Effortless Microservices Logging on Kubernetes: Your Guide to the EFK Stack

I am a Masters in Management Information Systems student @ State University of New York, Buffalo. I have 3 years of experience working in Site Reliability Engineer & Systems Engineer roles. I post content related to SRE, DevOps & Cloud.
INTRODUCTION
This project is all about getting hands-on with a sample microservices application called "Stan's Robot Shop" created by the awesome folks at IBM.
I am performing the following tasks in my project:
PART 1: DEPLOYING ON KUBERNETES EKS CLUSTER MANUALLY USING HELM CHARTS First part of the project will be to deploy this application on EKS Cluster using helm chart.
PART 2 : SETUP OF MONITORING WITH PROMETHES & GRAFANA
PART 3: LOGGING WITH EFK (Elasticsearch, FluentD ,Kibana) STACK SETUP
PART 4: Build an automation CI pipeline to build & publish images to ECR repo.
PART 5: Deploy the microservices application using Argo CD.
This Blog is demonstration of PART 3: LOGGING WITH EFK (Elasticsearch, FluentD ,Kibana) STACK SETUP
To know more about the project visit: Github
The "Stan's Robot Shop" application serves as an exceptional platform to enhance your practical skills in deploying microservices on a Kubernetes Managed Cluster (EKS). This application utilizes various technologies, including NodeJS, Java (Spring Boot), Python (Flask), Golang, PHP (Apache), and more, creating a practical & realistic microservices environment.
This Blog specifically focuses on Part 3 of the project – setting up the EFK Stack for logging within your EKS cluster. EFK stands for Elasticsearch, Fluentd, and Kibana, a powerful trio that forms a comprehensive log management solution.
Elasticsearch: A scalable and powerful search engine that serves as the foundation for storing and indexing your logs.
Fluentd: A log collector that gathers logs from various sources and forwards them to Elasticsearch for storage and analysis.
Kibana: A user-friendly web interface that allows you to visualize and analyze your logs, providing valuable insights into application behavior.
By deploying this EFK Stack on our EKS cluster, we'll build a centralized platform for managing and analyzing logs from our microservices application.
DEPLOYMENT METHOD
This project can be deployed in two ways, First way is directly applying the YAMLS .I have demonstrated this approach for this blog.
Second way is going the GitOps way ! We can create an ArgoCD application that watches this repository & deploys it efficiently on our EKS cluster.
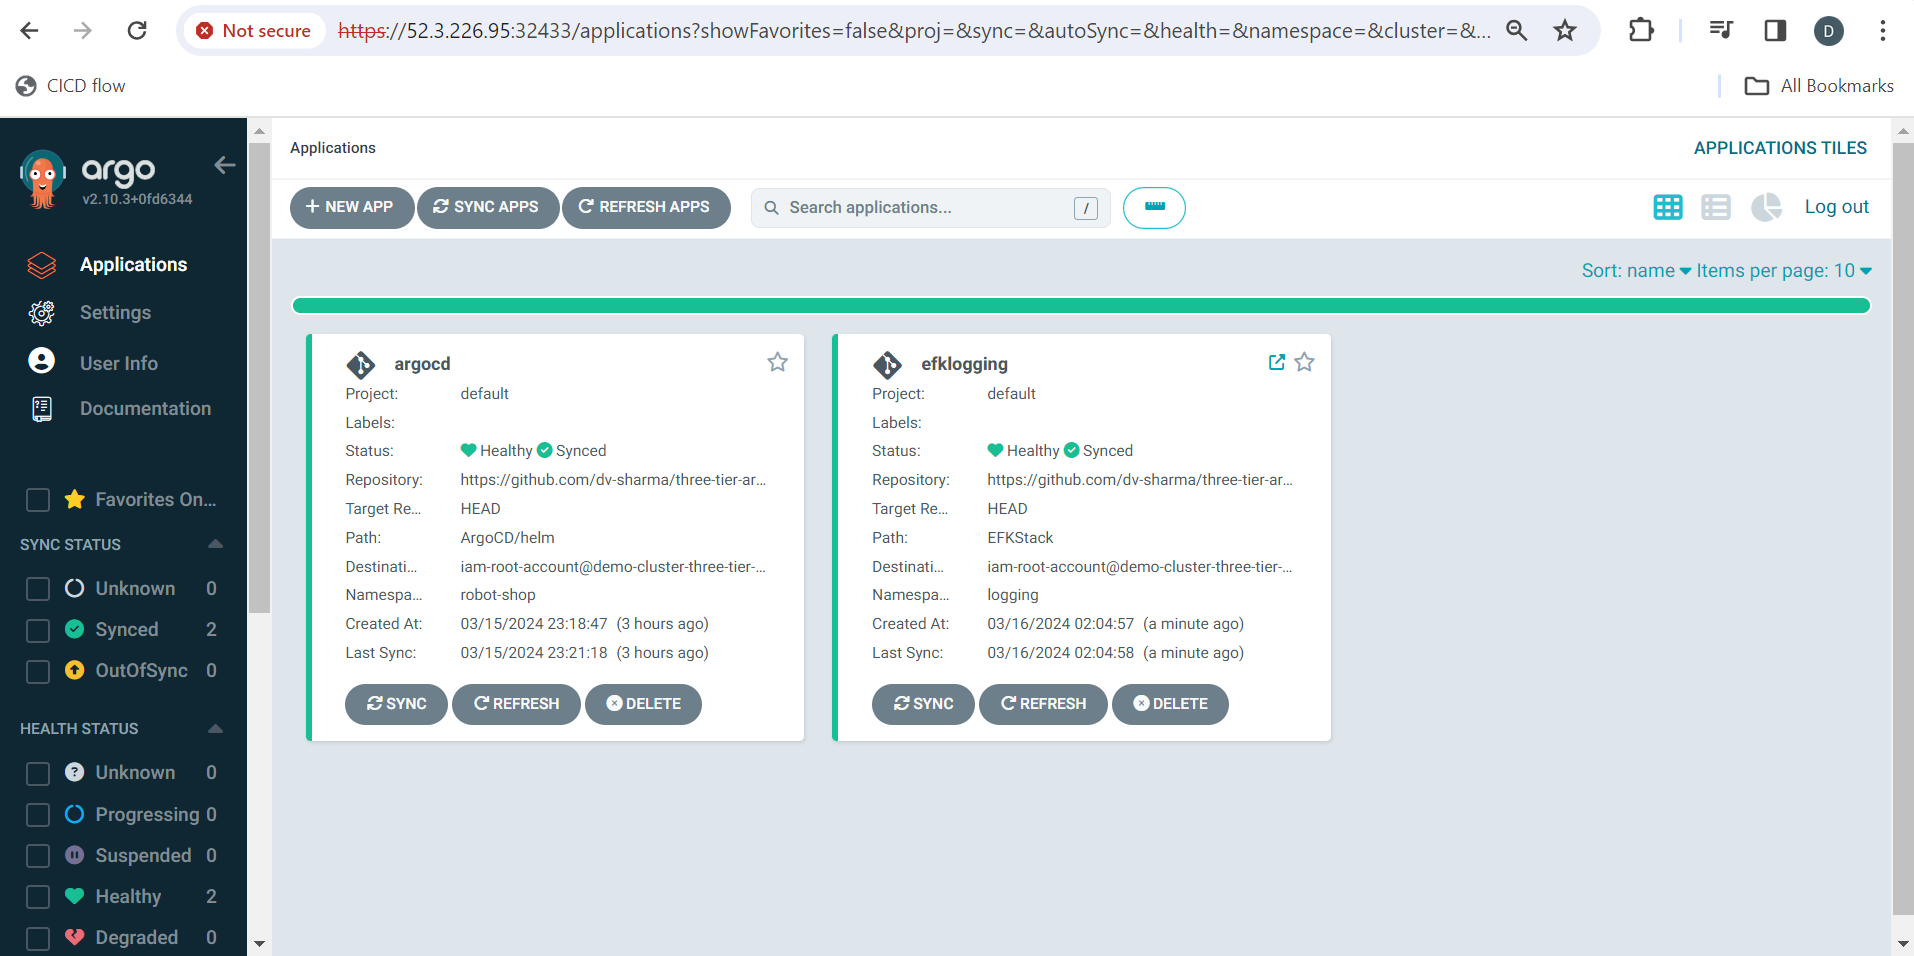
I have performed the deployment in both ways!
STEPS
- Go to the EFK repository & deploy the logging yamls with kubectl apply.
Find Code HERE
I have explained below what each yaml is doing!
Namespace setup: Namespace.yaml
We'll begin by creating a dedicated Namespace to isolate the EFK components from other applications running in the cluster. This ensures a well-organized and conflict-free deployment process.
---
apiVersion: v1
kind: Namespace
metadata:
   name: logging
...
Elasticsearch Service Definition :Elasticsearchsvc.yaml
apiVersion: v1
kind: Service
metadata:
  name: elasticsearch-logging
  namespace: logging
  labels:
    k8s-app: elasticsearch-logging
    addonmanager.kubernetes.io/mode: Reconcile
    kubernetes.io/name: "Elasticsearch"
spec:
  ports:
  - port: 9200
    protocol: TCP
    targetPort: db
  selector:
    k8s-app: elasticsearch-logging
Elasticsearchsvc.yaml creates a service named elasticsearch-logging that acts as a gateway to access our Elasticsearch cluster within the logging namespace.
Elasticsearch StatefulSet Deployment (Elasticstatefulset.yaml)
Why StatefulSets for Elasticsearch?
Elasticsearch, at its core, is a stateful application. It relies on persistent storage to maintain your log data.
StatefulSets provide the foundation for a robust and scalable Elasticsearch deployment within the EFK stack. This guarantees ordered pod startup, persistent storage for logs, and simplified management, allowing us to effectively collect, store, and analyze your application logs. They automate pod creation, ordering, and volume mounting, making managing your Elasticsearch cluster less complex.
# RBAC authn and authz
apiVersion: v1
kind: ServiceAccount
metadata:
  name: elasticsearch-logging
  namespace: logging
  labels:
    k8s-app: elasticsearch-logging
    addonmanager.kubernetes.io/mode: Reconcile
---
kind: ClusterRole
apiVersion: rbac.authorization.k8s.io/v1
metadata:
  name: elasticsearch-logging
  labels:
    k8s-app: elasticsearch-logging
    addonmanager.kubernetes.io/mode: Reconcile
rules:
- apiGroups:
  - ""
  resources:
  - "services"
  - "namespaces"
  - "endpoints"
  verbs:
  - "get"
---
kind: ClusterRoleBinding
apiVersion: rbac.authorization.k8s.io/v1
metadata:
  namespace: logging
  name: elasticsearch-logging
  labels:
    k8s-app: elasticsearch-logging
    addonmanager.kubernetes.io/mode: Reconcile
subjects:
- kind: ServiceAccount
  name: elasticsearch-logging
  namespace: logging
  apiGroup: ""
roleRef:
  kind: ClusterRole
  name: elasticsearch-logging
  apiGroup: ""
---
# Elasticsearch deployment itself
apiVersion: apps/v1
kind: StatefulSet
metadata:
  name: elasticsearch-logging
  namespace: logging
  labels:
    k8s-app: elasticsearch-logging
    version: v7.3.2
    addonmanager.kubernetes.io/mode: Reconcile
spec:
  serviceName: elasticsearch-logging
  replicas: 2
  selector:
    matchLabels:
      k8s-app: elasticsearch-logging
      version: v7.3.2
  template:
    metadata:
      labels:
        k8s-app: elasticsearch-logging
        version: v7.3.2
    spec:
      serviceAccountName: elasticsearch-logging
      containers:
      - image: quay.io/fluentd_elasticsearch/elasticsearch:v7.3.2
        name: elasticsearch-logging
        imagePullPolicy: Always
        resources:
          # need more cpu upon initialization, therefore burstable class
          limits:
            cpu: 500m
            memory: 3Gi
          requests:
            cpu: 100m
            memory: 1Gi
        ports:
        - containerPort: 9200
          name: db
          protocol: TCP
        - containerPort: 9300
          name: transport
          protocol: TCP
        volumeMounts:
        - name: elasticsearch-logging
          mountPath: /data
        env:
        - name: "NAMESPACE"
          valueFrom:
            fieldRef:
              fieldPath: metadata.namespace
      volumes:
      - name: elasticsearch-logging
      # Elasticsearch requires vm.max_map_count to be at least 262144.
      # If your OS already sets up this number to a higher value, feel free
      # to remove this init container.
      initContainers:
      - image: alpine:3.6
        command: ["/sbin/sysctl", "-w", "vm.max_map_count=262144"]
        name: elasticsearch-logging-init
        securityContext:
          privileged: true
Lets breakdown some of the main components of this yaml:
We are creating a ServiceAccount resource,Service accounts act as identities for pods, allowing them to request access to resources.
Clusterrole specifies the permissions pods with the elasticsearch-logging service account will have.
Clusterrolebinding binds the elasticsearch-logging cluster role to the elasticsearch-logging service account.
- This effectively assigns the defined permissions (
getaccess to services, namespaces, and endpoints) to pods using theelasticsearch-loggingservice account.
The label addonmanager.kubernetes.io/mode: Reconcile indicates that the Kubernetes resource (Service, ServiceAccount, ClusterRole, etc.) defined in the YAML file is managed by the Kubernetes addon-manager.
The initContainers section defines a container named elasticsearch-logging-init that runs with the alpine:3.6 image. This container serves ensures the necessary kernel parameter is configured before the main Elasticsearch container starts. This can be crucial for proper functioning of Elasticsearch within the Kubernetes environment.
Resources: Sets resource requests and limits for the container (CPU and memory).
Ports: Exposes ports 9200 (db) for database and 9300 (transport) for internal Elasticsearch communication.
Volume Mounts: Mounts a persistent volume claim named
elasticsearch-loggingto the/datadirectory within the container, providing persistent storage for log data.Volumes: Defines a volume named
elasticsearch-loggingto be mounted by the pod.Init Container : An init container is included to configure a kernel parameter (
vm.max_map_count) required by Elasticsearch.
You might be wondering we have not defined any Persistent Volume Claim , then how is our volume being provisioned? If you have followed the project, The answer is that EBS CSI driver directly provisions volumes without explicit PVCs, simplifying volume management. It works for our use case.
PVCs offer dynamic provisioning, separation of concerns, volume reuse, snapshots, and advanced storage features.
CONFIGMAP FOR FLUENTD (Configmapfluentd.yaml)
kind: ConfigMap
apiVersion: v1
metadata:
  name: fluentd-es-config-v0.2.0
  namespace: logging
  labels:
    addonmanager.kubernetes.io/mode: Reconcile
data:
  system.conf: |-
    <system>
      root_dir /tmp/fluentd-buffers/
    </system>

  containers.input.conf: |-
    # Configuration for collecting logs from Docker containers
    <source>
      @id fluentd-containers.log
      @type tail
      path /var/log/containers/*.log
      pos_file /var/log/es-containers.log.pos
      tag raw.kubernetes.*
      read_from_head true
      <parse>
        @type multi_format
        <pattern>
          format json
          time_key time
          time_format %Y-%m-%dT%H:%M:%S.%NZ
        </pattern>
        <pattern>
          format /^(?<time>.+) (?<stream>stdout|stderr) [^ ]* (?<log>.*)$/
          time_format %Y-%m-%dT%H:%M:%S.%N%:z
        </pattern>
      </parse>
    </source>
    <source>
      @id grafana-logs
      @type tail
      path /var/log/containers/*grafana*.log
      pos_file /var/log/es-grafana.log.pos
      tag grafana.log
      read_from_head true
      <parse>
        @type json
      </parse>
    </source>

  system.input.conf: |-
    # Configuration for collecting system logs
    <source>
      @id minion
      @type tail
      format /^(?<time>[^ ]* [^ ,]*)[^\[]*\[[^\]]*\]\[(?<severity>[^ \]]*) *\] (?<message>.*)$/
      time_format %Y-%m-%d %H:%M:%S
      path /var/log/salt/minion
      pos_file /var/log/salt.pos
      tag salt
    </source>

    <source>
      @id docker.log
      @type tail
      format /^time="(?<time>[^)]*)" level=(?<severity>[^ ]*) msg="(?<message>[^"]*)"( err="(?<error>[^"]*)")?( statusCode=($<status_code>\d+))?/
      path /var/log/docker.log
      pos_file /var/log/es-docker.log.pos
      tag docker
    </source>

    # Add more system logs sources if needed...

  forward.input.conf: |-
    # Configuration for accepting log messages over TCP
    <source>
      @id forward
      @type forward
    </source>

  monitoring.conf: |-
    # Prometheus Exporter Plugin
    # Input plugin that exports metrics
    <source>
      @id prometheus
      @type prometheus
    </source>

    <source>
      @id monitor_agent
      @type monitor_agent
    </source>

    # Input plugin that collects metrics from MonitorAgent
    <source>
      @id prometheus_monitor
      @type prometheus_monitor
      <labels>
        host ${hostname}
      </labels>
    </source>

    # Input plugin that collects metrics for output plugin
    <source>
      @id prometheus_output_monitor
      @type prometheus_output_monitor
      <labels>
        host ${hostname}
      </labels>
    </source>

    # Input plugin that collects metrics for in_tail plugin
    <source>
      @id prometheus_tail_monitor
      @type prometheus_tail_monitor
      <labels>
        host ${hostname}
      </labels>
    </source>

  output.conf: |-
    # Configuration for forwarding logs to Elasticsearch
    <match **>
      @id elasticsearch
      @type elasticsearch
      @log_level info
      type_name _doc
      include_tag_key true
      host elasticsearch-logging
      port 9200
      logstash_format true
      <buffer>
        @type file
        path /var/log/fluentd-buffers/kubernetes.system.buffer
        flush_mode interval
        retry_type exponential_backoff
        flush_thread_count 2
        flush_interval 5s
        retry_forever
        retry_max_interval 30
        chunk_limit_size 2M
        queue_limit_length 8
        overflow_action block
      </buffer>
    </match>
    <match grafana.log>
      @type elasticsearch
      @id grafana-elasticsearch
      @log_level info
      type_name _doc
      include_tag_key true
      host elasticsearch-logging
      port 9200
      logstash_format true
      index_name grafana-${Time.at(time).utc.strftime('%Y.%m.%d')}
      <buffer>
        @type file
        path /var/log/fluentd-buffers/grafana.buffer
        flush_mode interval
        retry_type exponential_backoff
        flush_thread_count 2
        flush_interval 5s
        retry_forever
        retry_max_interval 30
        chunk_limit_size 2M
        queue_limit_length 8
        overflow_action block
      </buffer>
    </match>
system.conf: This section specifies configuration options for the Fluentd system, such as the root directory for storing Fluentd buffers.
containers.input.conf: This section defines input configurations for Fluentd to collect logs from Docker containers running on Kubernetes. It specifies how Fluentd should read Docker log files, parse log entries, enrich records with Kubernetes metadata, and forward them to Elasticsearch.
system.input.conf: This part configures Fluentd to collect system logs from various sources like
salt,startupscript,docker,etcd,kubelet, etc., and forward them to Elasticsearch.forward.input.conf: This section configures Fluentd to accept log messages over TCP using the forward input plugin.
monitoring.conf: Here, monitoring plugins for Fluentd are configured to export metrics to Prometheus. This includes collecting metrics from Fluentd itself, as well as from other sources like MonitorAgent.
output.conf: This section defines the output destination for Fluentd logs, which in this case is Elasticsearch. It specifies the Elasticsearch host, port, and other settings. There are separate configurations for general logs and specific logs from Grafana.
The
<source>block specifies that Fluentd should tail log files from/var/log/containers/*.log.The
<parse>section ensures that Fluentd correctly parses JSON logs with the specified time format.The
<match>block sends logs to an Elasticsearch instance (adjust thehostandportas needed).
CONFIGMAP DAEMONSET (Daemonsetfluentd.yaml)
apiVersion: v1
kind: ServiceAccount
metadata:
  name: fluentd-es
  namespace: logging
  labels:
    k8s-app: fluentd-es
    addonmanager.kubernetes.io/mode: Reconcile
---
kind: ClusterRole
apiVersion: rbac.authorization.k8s.io/v1
metadata:
  name: fluentd-es
  labels:
    k8s-app: fluentd-es
    addonmanager.kubernetes.io/mode: Reconcile
rules:
- apiGroups:
  - ""
  resources:
  - "namespaces"
  - "pods"
  verbs:
  - "get"
  - "watch"
  - "list"
---
kind: ClusterRoleBinding
apiVersion: rbac.authorization.k8s.io/v1
metadata:
  name: fluentd-es
  labels:
    k8s-app: fluentd-es
    addonmanager.kubernetes.io/mode: Reconcile
subjects:
- kind: ServiceAccount
  name: fluentd-es
  namespace: logging
  apiGroup: ""
roleRef:
  kind: ClusterRole
  name: fluentd-es
  apiGroup: ""
---
apiVersion: apps/v1
kind: DaemonSet
metadata:
  name: fluentd-es-v2.7.0
  namespace: logging
  labels:
    k8s-app: fluentd-es
    version: v2.7.0
    addonmanager.kubernetes.io/mode: Reconcile
spec:
  selector:
    matchLabels:
      k8s-app: fluentd-es
      version: v2.7.0
  template:
    metadata:
      labels:
        k8s-app: fluentd-es
        version: v2.7.0
      # This annotation ensures that fluentd does not get evicted if the node
      # supports critical pod annotation based priority scheme.
      # Note that this does not guarantee admission on the nodes (#40573).
      annotations:
        scheduler.alpha.kubernetes.io/critical-pod: ''
    spec:
      serviceAccountName: fluentd-es
      containers:
      - name: fluentd-es
        image: quay.io/fluentd_elasticsearch/fluentd:v2.7.0
        env:
        - name: FLUENTD_ARGS
          value: --no-supervisor -q
        resources:
          limits:
            memory: 500Mi
          requests:
            cpu: 100m
            memory: 200Mi
        volumeMounts:
        - name: varlog
          mountPath: /var/log
        - name: varlibdockercontainers
          mountPath: /var/lib/docker/containers
          readOnly: true
        - name: config-volume
          mountPath: /etc/fluent/config.d
      terminationGracePeriodSeconds: 30
      volumes:
      - name: varlog
        hostPath:
          path: /var/log
      - name: varlibdockercontainers
        hostPath:
          path: /var/lib/docker/containers
      - name: config-volume
        configMap:
          name: fluentd-es-config-v0.2.0
Fluentd DaemonSets are essential for consistent log collection across Kubernetes nodes. They ensure that every node contributes to the centralized log pipeline.
Purpose of Fluentd DaemonSet:
Log Collection: Fluentd collects logs from various sources (files, standard output, etc.) across all nodes.
Centralized Forwarding: It forwards logs to a centralized destination (e.g., Elasticsearch, Logstash, or other logging systems).
Uniform Logging: Ensures consistent log collection and forwarding across the entire cluster.
This YAML file sets up Fluentd, a log collector, within a Kubernetes cluster:
Service Account: Defines a service account for Fluentd with necessary permissions.
Cluster Role: Specifies permissions for Fluentd to access Kubernetes resources.
Cluster Role Binding: Binds the service account to the cluster role.
DaemonSet: Deploys Fluentd pods across all nodes in the cluster.
Configures Fluentd container settings, including image, environment variables, and resources.
Mounts host paths and a ConfigMap for configuration files.
Defines a termination grace period for pod termination.
KIBANA DEPLOYMENT (Deploymentkibana.yaml)
apiVersion: apps/v1
kind: Deployment
metadata:
  name: kibana-logging
  namespace: logging
  labels:
    k8s-app: kibana-logging
spec:
  replicas: 1
  selector:
    matchLabels:
      k8s-app: kibana-logging
  template:
    metadata:
      labels:
        k8s-app: kibana-logging
    spec:
      containers:
      - name: kibana-logging
        image: docker.elastic.co/kibana/kibana-oss:7.3.2
        resources:

          limits:
            cpu: 1000m
          requests:
            cpu: 100m
        env:
          - name: ELASTICSEARCH_HOSTS
            value: http://elasticsearch-logging:9200
          - name: SERVER_NAME
            value: kibana-logging

         # - name: SERVER_BASEPATH
         #   value: /api/v1/namespaces/efk-aks/services/kibana-logging/proxy

        ports:
        - containerPort: 5601
          name: ui
          protocol: TCP
This yaml is self explanatory if you have followed the above steps.
KIBANA SERVICE (Kibanasvc.yaml)
apiVersion: v1
kind: Service
metadata:
  name: kibana-logging
  namespace: logging
  labels:
    k8s-app: kibana-logging
    kubernetes.io/name: "Kibana"
spec:
  ports:
  - port: 5601
    protocol: TCP
    targetPort: ui
  selector:
    k8s-app: kibana-logging
We have created deployment & service for our Kibana, Now we want to access this through external world, so we will create an Ingress resource for Kibana.
kibanaingress.yaml
apiVersion: v1
kind: Service
metadata:
  name: kibana-logging
  namespace: logging
  labels:
    k8s-app: kibana-logging
    kubernetes.io/name: "Kibana"
spec:
  ports:
  - port: 5601
    protocol: TCP
    targetPort: ui
  selector:
    k8s-app: kibana-logging
Access the service via the ingress URL
KIBANA IS ACCESSIBLE!
Click the Discover tab .
Enter
"*"in an index or the index you have defined in the configmap output block.Voila! You can view the application logs of our microservices.
LOG ANALYSIS
I went to my application & created an Order, OrderID of which can be seen
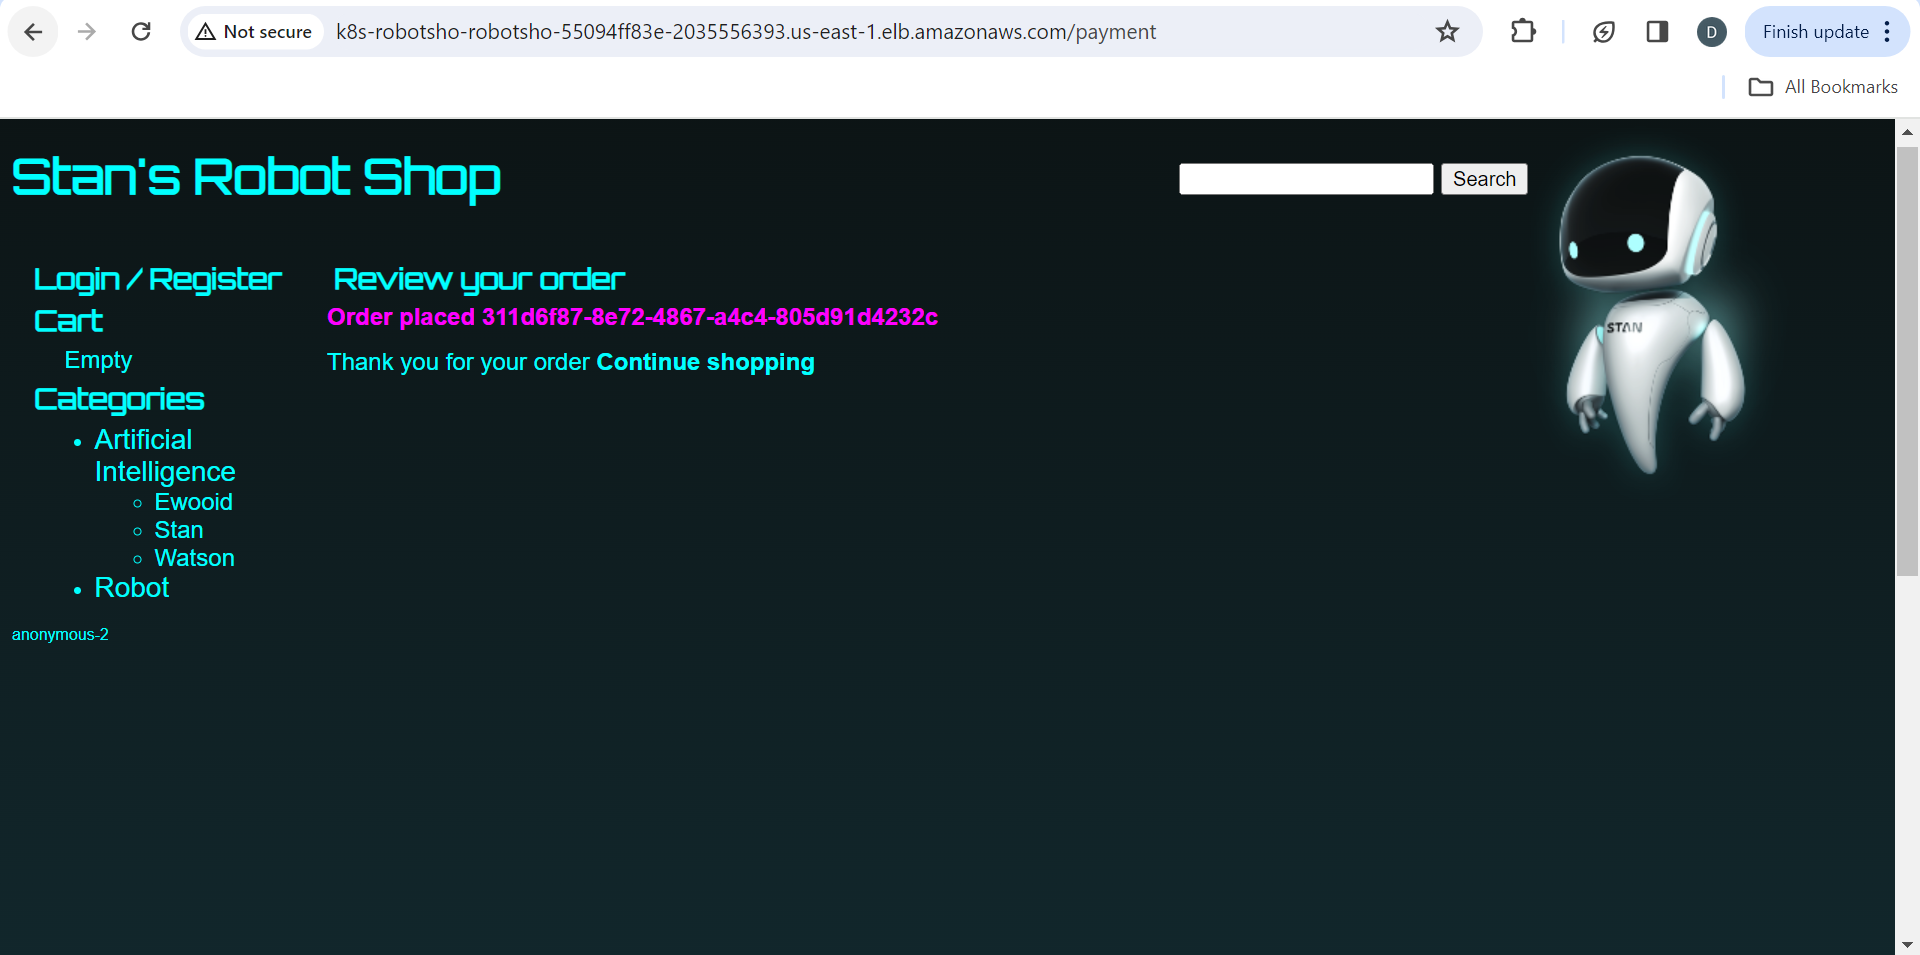
Doing some tweaking with the filters, I can see the payload & other essential attributes of my request . This is a gamechanger when you face application issues!

I can also filter out on basis of namespace, containers etc., In this case I can figure out which microservice is throwing the most 500 errors !
Based on the error log count an SRE can create tickets for the developers to fix the issue.

SUMMARY
By deploying the EFK Stack, we created a centralized platform for managing and analyzing logs from our microservices application, enabling us to gain valuable insights into application behavior and troubleshoot issues effectively.
Additionally, we provided detailed YAML configurations and explanations for setting up Elasticsearch, Fluentd DaemonSet, Kibana deployment, and other components necessary for logging.
I will be writing a separate blog for the ArgoCD implementation, so stay tuned & follow me if you liked this one.
Feel free to fork this repository & try it out yourself. For deployment of the 3-TIER Application follow this amazing video by Abhishek Veeramalla :VIDEO
OR
Stay tuned for my next Blog which will be about:
PART 4: Build an automation CI pipeline to build & publish images to ECR repo.
PART 5: Deploy the microservices application using Argo CD.
If you found this blog helpful and want to stay updated on future articles, follow me onLinkedIn *and my blog. I'm actively seeking new opportunities where I can leverage my expertise in cloud-native technologies to drive innovation and deliver impactful projects. Reach out to me via LinkedIn or email:*divyamsha05@gmail.com*if you're interested in collaborating or discussing potential opportunities.*


